
Back in November, before the World Cup began, I dove into the treasure trove that is StatsPerform's World Cup charting data archive to look at the trends that have changed and taken over the sport from 1966 to 2018. When did the possession game start to really take over? (1990 or so, and then for real in 2014.) When did teams begin sacrificing shot quantity for shot quality? (Very much 2014.) Was 2018 as strange an outlier for set piece efficiency as it seemed? (Yes.)
With the 2022 World Cup almost complete, we now have another data set to take in. What have we learned over the past month or so that tells us how the sport might be evolving? And were some of the results as funky as they seemed? (Yes.)
- World Cup 2022: News and features | Schedule | Bracket
Lesson 1: (Predictive) stats are for losers
OK, not really. Stats are the language we use to speak about a game, and the existence of this StatsPerform data going back to England 1966 is an absolute blessing. But some years give us funkier results than others.
For each of the 15 World Cups in the data set, let's look at the correlation between each team's points per game and its expected goals (xG) differential. (Note: If you won a knockout match in a penalty shootout, we're counting that as a draw for these purposes. Sorry, Croatia.)
Over a long enough period of time, your xG differential becomes very predictive of success moving forward. It's basically looking at the quality of the shots you produce versus that of your opponent, and while finishing skill obviously matters, it only matters so much. Give all these teams 100 games, and the ranking of xG differential will look just about exactly like your points-per-game ranking. Guarantee teams just three matches, and you're going to get some funky results. And the results in 2022 were particularly funky.
Correlation between points per game and xG differential:
1966: 0.532
1970: 0.770
1974: 0.845
1978: 0.571
1982: 0.554
1986: 0.765
1990: 0.694
1994: 0.476
1998: 0.488
2002: 0.552
2006: 0.713
2010: 0.446
2014: 0.603
2018: 0.598
2022: 0.464
(Note: correlations come on a scale from -1 to 1. The closer it is to 1, the stronger the "When one goes up/down, the other goes up/down" connection. The closer it is to -1, the stronger the opposite link -- when one goes up, the other goes down. And the closer it is to 0, the weaker the overall link between the two.)
What this tells us: While every stats teacher in the world will quickly point out that correlation doesn't equal causation, we can say that, in this case, a high correlation between these two measures suggests that a given tournament had a lower number of strange, "Team A took three shots worth 0.1 xG, Team B took 17 shots worth 2.2, and Team A won, 1-0" results.
As you see above, the 1974 World Cup had the highest correlation on the board. That year, Netherlands and West Germany produced by far the strongest xG figures in the competition and met in the final. There were some reasonably funky results -- a pretty mediocre Brazil team (xG differential: +0.1 per match) reached the semifinals, while Scotland (+0.3) produced the third-best differential and failed to advance from the group stage. (They were tied with Yugoslavia and Brazil in Group 2 but fell short because of goal differential.) But all in all, the stats and results mostly agreed on the hierarchy of teams.
That has really not been the case at Qatar 2022. The team with by far the best xG differential in the competition -- Germany (+2.2 per match) -- finished third in Group E thanks to a super funky 2-1 loss to Japan (xG: Germany 3.1, Japan 1.5) and the goal-differential wrecker that was Spain's 7-0 win over Costa Rica. Stats: literally for losers in this case.
The second-best team in the tournament, per xG differential? Brazil, which lost in a quarterfinal penalty shootout against Croatia. The teams drew 1-1 over 120 minutes despite a lopsided xG margin (Brazil 2.6, Croatia 0.6.)
To date, the tournament's four semifinalists rank third (Argentina), fourth (France) ... 19th (Morocco) and 23rd (Croatia) in xG differential. Croatia's back-to-back shootout wins over Japan and Brazil and Morocco's back-to-back upsets of Spain (shootout) and Portugal (1-0) were incredible underdog stories and legacy builders for both Croatia's Luka Modric and virtually everyone associated with the Morocco national team. But they weren't results that were likely to happen twice.
OK, so the data and the results didn't really match up this year. But what can the data tell us about overall trends?
- Stream on ESPN+: LaLiga, Bundesliga, more (U.S.)
The possession obsession continues (but is bearing less fruit?)
While the better teams in a given competition can usually be relied on to have some of the heavier possession rates, the extremes have grown increasingly extreme over time. In 1966 and 1970, no one had a possession rate over 56%, and the first team didn't top 60% until Colombia in 1994. In 2018, both Spain and Germany topped 70%.
This year we had only one 70+% team (Spain, of course), but the overall trends remain pretty easy to spot.
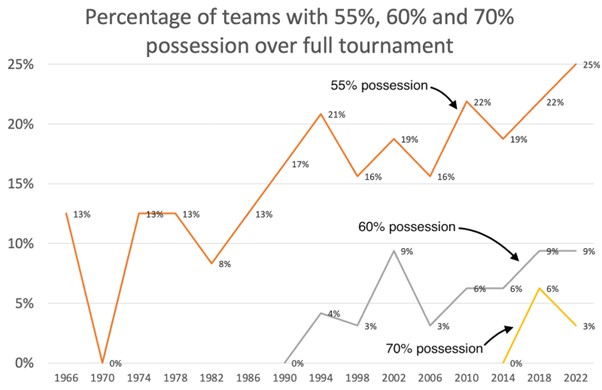
In Qatar, a full quarter of the field -- eight of 32 teams -- ended up with at least 55% of the ball. (It was nine teams until Croatia dipped to 54.8% after the semifinals.)
Interestingly, however, the correlation between dominating the ball and actually winning has dipped dramatically in recent tournaments.
Correlation between possession rate and points per game:
2006: 0.706
2010: 0.429 (down 39% from 2006)
2014: 0.275 (down 36%)
2018: 0.202 (down 27%)
2022: 0.159 (down 21%)
In 2006, 13 teams had a possession rate of 51% or higher, 11 of them made the knockout rounds and five made the quarterfinals. Granted, finalists France and Italy were both in the 49% range, but there was a clear link between having the ball and doing good things with it.
In 2022, 15 teams had a possession rate of 51% or higher, and only nine of them made the knockout rounds. Germany and Denmark were both at 59.8% and suffered group-stage elimination. Meanwhile, of the six teams with possession rates under 38%, four made the knockout rounds (Morocco, which made the semis, plus Japan, Poland and Australia), another one nearly did (Iran) and yet another looked like it might for a moment on the final matchday (Costa Rica). Points per game per team for those with a possession rate above 50%: 1.4. For those below 50%: 1.2.
I don't want to overreact to this because there were indeed some wild and seemingly fluky results in this group -- Japan-Germany, among others. But not every "low-possession team wins" result was a fluke. Spain held 76% possession against Morocco, for instance, but created 13 shots worth only 1.0 xG while, with only 24% of the ball, Morocco nearly matched them with six shots worth 0.7.
Spain's Rodri, frustrated after the loss, said that "Morocco offered absolutely nothing." That was sort of true, but they made sure Spain offered almost nothing as well. And against Portugal, Morocco had only 27% possession but created nine shots worth 1.4 xG to Portugal's 12 worth 0.9. They attempted two shots worth at least 0.38 xG and scored on one of them, while Portugal's best chance was worth just 0.18 xG. They were easily the match's more dangerous team despite attempting 247 passes to Portugal's 663.
This competition was the continuation of a pretty clear and harsh trend. It is increasingly clear that teams are more comfortable than ever without the ball. That doesn't mean it's better to play without possession, and at the club level, where most of the richest and most talented teams will continue to dominate the ball, the correlations between possession and winning will remain.
But in a bit more of a democratic sample, where even the richest teams cannot paper over weaknesses by purchasing the rights to talented players and squads tend to have a few more holes, we see that Johan Cruyff's famous "There is only one ball, so you need to have it" quote doesn't ring quite as true as it used to.
The ball remains on the perimeter
One of the steadiest trends over the 15 World Cups in this sample has been that the ball leaves the middle of the pitch, in favor of one wing or the other, a bit more each year. Looking specifically at touches that occur when a team has the ball in the attacking third, as recently as 1982 teams were enjoying as many touches in the middle of the pitch (horizontally) as they were on either wing. That has changed dramatically since.
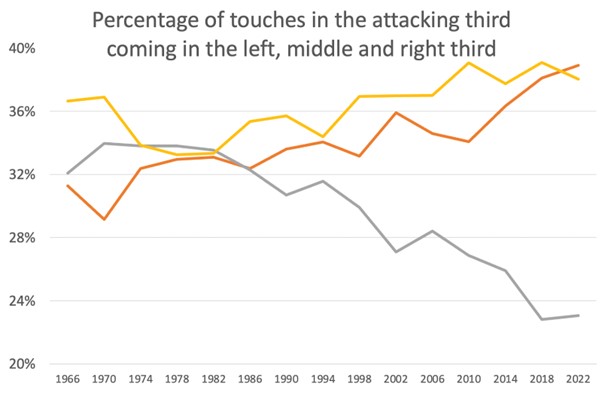
With each progressive World Cup, the ball has spent less time in central attacking areas and more time on either wing. And after the percentage of center-third touches increased a bit in 2006, it quickly went down from there.
If you want to draw a connection between this trend and the anti-possession trend above, look no further than Spain, who have in many ways served as the sport's harbinger for the past 15 years or so.
In 2010, Spain won the World Cup with a 65% possession rate, with 31% of its attacking-third touches coming in the middle third of the pitch. In their World Cup matches that year, they enjoyed 79% of all touches generated by either team in the defender's box.
By 2018, their possession rate was up to 74%, but only 23% of their attacking-third touches came in the middle. They were getting steered more to the outside, both as opponents adjusted and as incredible midfielders like Andres Iniesta and Xavi aged out of the player pool. While they possessed the ball more than ever, they commandeered only 70% of all touches in the box.
This year, Spain's possession rate was up to 77%, with their percentage of touches in the box down to 66%. The three teams with possession rates over 60% (Spain, England and Portugal) combined to produce only 25% of their attacking-third touches in the middle. As defenses placed more bodies near the center to account for the Spains and FC Barcelonas of the world, attacks have had to come from the outside in.
Shot quality continues to improve (as shot quantity continues to regress)
You can draw a pretty clear line between the rise of analytics in soccer -- in particular, the use of xG -- and a change in both shot quality and quantity. Teams are less likely to attempt long-distance "hero" shots than they used to be, and part of being a possession-heavy team means being more patient when it comes to waiting for more high-quality shots to appear.
At the World Cup, though, at least part of this trend began long before xG became a thing.
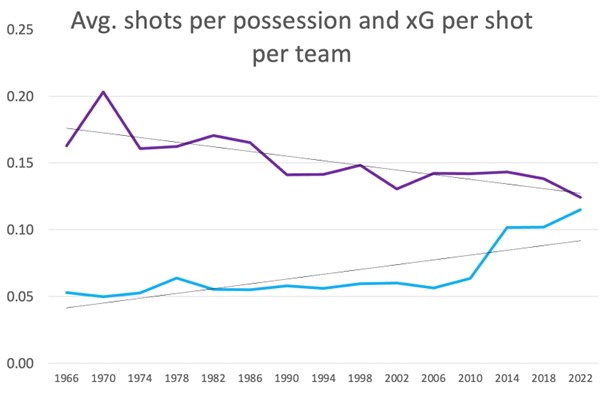
The average xG per shot remained unchanged for most of the period between 1966 and 2010, but shots slowly trended downward from 1974 on. There is no question, however, that shot quality has skyrocketed of late. It began with velocity in 2014 and has risen even further in 2022.
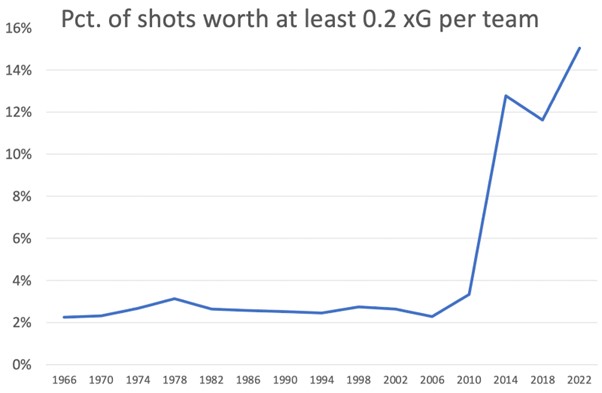
In 2010, Nigeria led the World Cup by averaging 0.085 xG per shot. In 2014, that would have ranked 23rd out of 32 teams, and in 2022 Denmark's 0.085 ranked 29th. In 2010, 3.3% of shots were worth at least 0.2 xG; in 2022, it's 15.0%.
For emphasis: This is a massive shift.
Is this due to penalties? Not really. There were 15 penalty attempts (not including shootouts) in the 2010 World Cup, and there have been 20 thus far in Qatar. But transition goals jumped in 2014, while set piece goals had a moment in 2018. This year, despite set piece goals dropping significantly -- from 65 in 2018 to just 37 thus far -- shot quality has continued to quickly trend upward.
We can loosely paint a picture here. Ball-dominant teams are controlling possession more than ever before, but they're getting steered to less dangerous areas of the pitch (outside of the middle), and they're waiting for high-quality shot opportunities to present themselves. Defensively organized teams are more capable than ever of preventing those shots from materializing, teams such as Morocco are finding defense-plus-transition combinations good enough to outplay creative and ball-dominant teams such as Portugal and the game is growing a little bit less predictable overall.
Is this picture accurate? I guess we'll find out in four years when we add more data to the sample.